
impact analysis
A typical farmer in Southern Zambia produces 3,500kg of maize and owns 8 cattle & 8 goats. Livestock sales provides farmers with their largest source of cash income. Maize represents their single biggest source of food but is also their second most important source of cash.
But not all farmers are the same and these averages mask significant differences between poorer and wealthier farmers. Poorer farmers, who represent about 60% of farmers, typically produce 1,500kg of maize and only own fewer livestock. The difference between Very Poor & Poor farmers comes down to the number of cattle they own, rather than how much maize they grow. 2 cows makes all the difference; Very Poor farmers own 2 cows while Poor farmers own 4. This means that Poor farmers can afford to sell one cow every year, but Very Poor farmers cannot, they only sell goats. The wealthiest farmers buy significantly more fertilizer than other farmers and as a result have a much larger maize harvest. These differences in production also mean that wealthier farmers, who represent 40% of the population, produce 80% of the surplus maize that is sold into local markets.
Moderate drought halves farmers maize production, reducing both their food & cash income. Farmers sell more cattle as a coping strategy. But poorer households, who own few livestock, are unable meet their minimum health, education & livelihood expenditure during a moderate drought.
Between 2014 and 2019 an average of 1,027,198 people in Zambia were unable to meet their minimum food requirements but there was significant variation over this period with:
one year of severe drought, with over 2 million people facing food insecurity
three years of moderate drought, with almost 1 million people facing food insecurity
two years with lower levels of insecurity.
Farmers that grow sorghum increase their profits when rains are good & when there’s drought. Crucially, this increased profitability is enough to enable poorer farmers to meet their minimum health, education & livelihood expenditure requirements.
Sorghum is naturally adapted to the irregular rainfall and poor soils that characterise Southern Zambia. Sorghum can produce a good yield without using fertilizer, which means that when the rains are good it can still be more profitable than maize, which does require fertilizer, even if yields are slightly lower. During a drought, sorghum yields only reduce by 25% compared to a 50% reduced for maize, which means that sorghum produce both a higher yields and larger profit.
The stability that sorghum provides is critical because it means that households do not have to sell key assets (livestock) in order to cope with drought. This enables them to grow their assets over time, rather than constantly taking two steps forward & one step back.
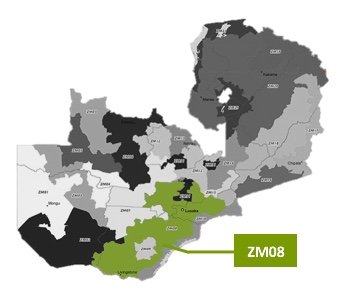
Baseline: ZM08
An HEA baseline quantifies household food, income and expenditure for households of different wealth groups within a common livelihood zone. In our analysis we used WFP’s 2014/15 HEA baseline for the Commercial Rail Line Maize, Livestock and Cotton (ZM08) livelihood zone which covers much of Southern Province, including parts of Kalomo. Note that the plateau area of Kalomo is covered by a separate livelihood zone (ZM09).
Small-scale farmers in the ZM08 livelihood zone, grow maize and raise livestock. A typical farmer will produce 3,500kg of maize and owns 8 cattle and 8 goats. But not all small-scale farmers are the same and these averages mask significant differences between poorer and wealthier farmers. The HEA baseline provides an analysis of household economy for four separate wealth groups; Very Poor, Poor, Middle & Better-off: Very Poor farmers, who represent 33% of the population, produce about 1,300 kg of maize and own 2 cattle and 3 goats. Poor farmers, who represent 27% of the population, have similar crop production but own more livestock (4 cattle and 7 goats). Middle income farmers harvest almost twice as much maize as poorer farmers (2,750kg) and also own more livestock (7 cows & 9 goats). Better-off farmers only account for 15% of the rural population, but they have significantly higher maize production and own many more livestock (17 cows & 12 goats).
Maize provides 66% of annual food needs for poorer households and increases to almost 80% for wealthier households. Maize is also an important, but secondary, source of income for households in every wealth group. Even the poorest households sell up to a third of their maize harvest but it is only the very wealthiest households for whom maize represents their primary source of cash income. The wealthiest farmers buy significantly more fertilizer than other farmers and as a result have a much larger maize harvest. These differences in production also mean that wealthier farmers, from the Middle & Better-off wealth groups, who represent 40% of the population produce 80% of the surplus maize that is sold into local markets.
Livestock play a critical role in the household economy of farmers in Southern Province providing farmers with almost 50% of their cash income. Most small-scale farmers will sell one cow and a handful of goats each year. However, the poorest farmers rely on goat sales alone since they own few cattle and as a result income from livestock only represents about 20% of the cash income for Very Poor households.
2. Model the Hazard: Moderate Drought
Using HEA’s inherent modelling capacity we can model the impact of a shock or hazard, such as drought, on household’s food, income & expenditure. This enables us to determine which wealth groups are able to meet their minimum food requirements and protect their livelihood – and which are not. In order to do this the impact of the hazard is translated into the economic consequences at household level, such as a reduction in crop production or increase in food prices. The model also incorporates household coping strategies that reduce non-essential expenditure and increase income within sustainable limits (e.g. increase livestock sales). A key feature of the HEA modelling process is the comparison of household income to two expenditure thresholds with represent households minimum food requirements (the survival threshold) and the expenditure required to support their livelihoods, health & education (the livelihoods protection threshold).
Baseline + Hazard + Coping = Outcome
In order to identify moderate drought years we reviewed the seasonal vulnerability assessments conducted by DMMU / ZVAC over the six years since the HEA baseline. Between 2014 and 2019 an average of 1,027,198 people in Zambia were unable to meet their minimum food requirements but there was significant variation over this period with:
one year of severe drought, with over 2 million people facing food insecurity
three years of moderate drought, with almost 1 million people facing food insecurity
two years with lower levels of insecurity.
Southern Province was less affected in one of the three moderate drought years (2016/17). We have therefore used 2015/16 & 2018/19 to represent moderate drought in Southern Province.